SpringBoot+Prometheus+Grafana實(shí)現(xiàn)應(yīng)用監(jiān)控和報(bào)警的詳細(xì)步驟
SpringBoot的應(yīng)用監(jiān)控方案比較多,SpringBoot+Prometheus+Grafana是目前比較常用的方案之一。它們?nèi)咧g的關(guān)系大概如下圖:

首先,創(chuàng)建一個(gè)SpringBoot項(xiàng)目,pom文件如下:
<dependency> <groupId>org.springframework.boot</groupId> <artifactId>spring-boot-starter-actuator</artifactId> </dependency> <dependency> <groupId>org.springframework.boot</groupId> <artifactId>spring-boot-starter-web</artifactId> </dependency> <dependency> <groupId>org.projectlombok</groupId> <artifactId>lombok</artifactId> <optional>true</optional> </dependency> <!-- https://mvnrepository.com/artifact/io.prometheus/simpleclient_spring_boot --> <dependency> <groupId>io.prometheus</groupId> <artifactId>simpleclient_spring_boot</artifactId> <version>0.8.1</version> </dependency> <dependency> <groupId>org.springframework.boot</groupId> <artifactId>spring-boot-starter-security</artifactId> </dependency>
注意: 這里的SpringBoot版本是1.5.7.RELEASE,之所以不用最新的2.X是因?yàn)樽钚碌膕impleclient_spring_boot只支持1.5.X,不確定2.X版本的能否支持。
MonitorDemoApplication啟動(dòng)類增加注解
package cn.sp; import io.prometheus.client.spring.boot.EnablePrometheusEndpoint; import io.prometheus.client.spring.boot.EnableSpringBootMetricsCollector; import org.springframework.boot.SpringApplication; import org.springframework.boot.autoconfigure.SpringBootApplication; @EnablePrometheusEndpoint @EnableSpringBootMetricsCollector @SpringBootApplication public class MonitorDemoApplication { public static void main(String[] args) { SpringApplication.run(MonitorDemoApplication.class, args); } }
配置文件application.yml
server: port: 8848 spring: application: name: monitor-demo security: user: name: admin password: 1234 basic: enabled: true # 安全路徑列表,逗號(hào)分隔,此處只針對(duì)/admin路徑進(jìn)行認(rèn)證 path: /admin # actuator暴露接口的前綴 management: context-path: /admin # actuator暴露接口使用的端口,為了和api接口使用的端口進(jìn)行分離 port: 8888 security: enabled: true roles: SUPERUSER
測(cè)試代碼TestController
@RequestMapping('/heap/test')@RestControllerpublic class TestController { public static final Map<String, Object> map = new ConcurrentHashMap<>(); @RequestMapping('') public String testHeapUsed() { for (int i = 0; i < 10000000; i++) { map.put(i + '', new Object()); } return 'ok'; }}
這里的邏輯就是在請(qǐng)求這個(gè)接口后,創(chuàng)建大量對(duì)象保存到map中增加堆內(nèi)存使用量,方便后面測(cè)試郵件報(bào)警。
啟動(dòng)項(xiàng)目后,可以在IDEA中看到有很多Endpoints,如圖:
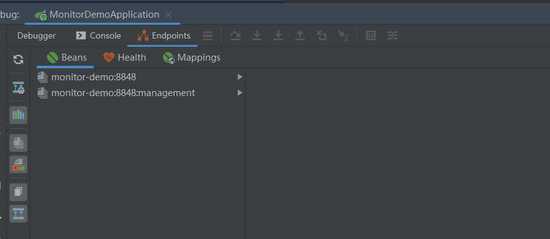
開(kāi)始我的IDEA是不顯示這個(gè)Endpoints,后來(lái)發(fā)現(xiàn)是我使用的idea版本太老了,還是2017.1的,
而這個(gè)需要 idea2017.2版本以上才能看到。
后來(lái)只好重新下載安裝,弄了好久。。。。
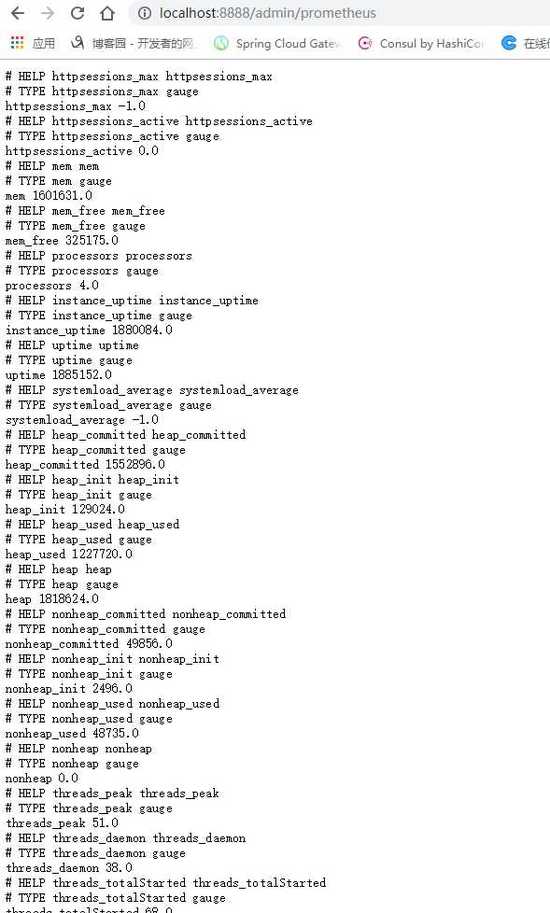
啟動(dòng)完畢,訪問(wèn)http://localhost:8888/admin/prometheus就可以看到服務(wù)暴露的那些監(jiān)控指標(biāo)了。
注意:
由于開(kāi)啟了安全認(rèn)證,所以訪問(wèn)這個(gè)URL的需要提示輸入賬號(hào)/密碼,如果提示404請(qǐng)檢查下你的請(qǐng)求地址是否正確,如果不設(shè)置management.context-path則默認(rèn)地址是http://ip:port/prometheus
安裝Prometheus下載地址點(diǎn)擊這里,本文下載的是Windows版本prometheus-2.17.2.windows-amd64.tar.gz。
解壓后修改prometheus.yml文件,配置數(shù)據(jù)采集的目標(biāo)信息。
scrape_configs: # The job name is added as a label `job=<job_name>` to any timeseries scraped from this config. # - job_name: ’prometheus’ # metrics_path defaults to ’/metrics’ # scheme defaults to ’http’. # static_configs: # - targets: [’localhost:9090’] - job_name: ’monitor-demo’ scrape_interval: 5s # 刮取的時(shí)間間隔 scrape_timeout: 5s metrics_path: /admin/prometheus scheme: http basic_auth: #認(rèn)證信息 username: admin password: 1234 static_configs: - targets: - 127.0.0.1:8888 #此處填寫(xiě) Spring Boot 應(yīng)用的 IP + 端口號(hào)
更多配置信息請(qǐng)查看官方文檔。
現(xiàn)在可以啟動(dòng)Prometheus了,命令行輸入:prometheus.exe ?config.file=prometheus.yml
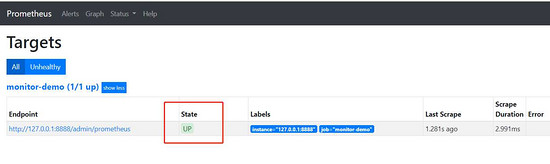
訪問(wèn)http://localhost:9090/targets,查看Spring Boot采集狀態(tài)是否正常。
下載地址點(diǎn)擊這里,本文用到的是Windows版本grafana-6.3.3.windows-amd64.zip。
解壓后運(yùn)行bin目錄下的grafana-server.exe啟動(dòng),游覽器訪問(wèn)http://localhost:3000即可看到登錄頁(yè)面,默認(rèn)賬號(hào)密碼是admin/admin。
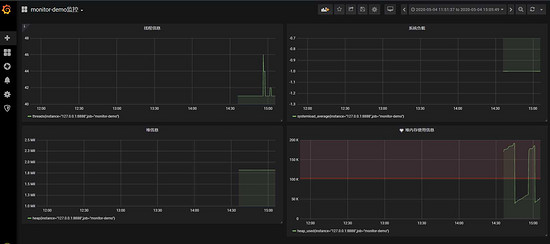
現(xiàn)在開(kāi)始創(chuàng)建自己的可視化監(jiān)控面板。
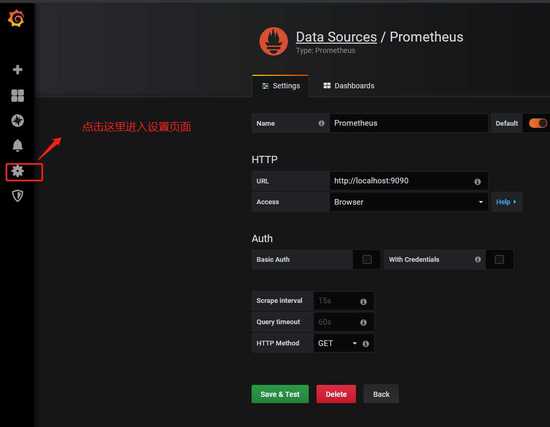
1.設(shè)置數(shù)據(jù)源
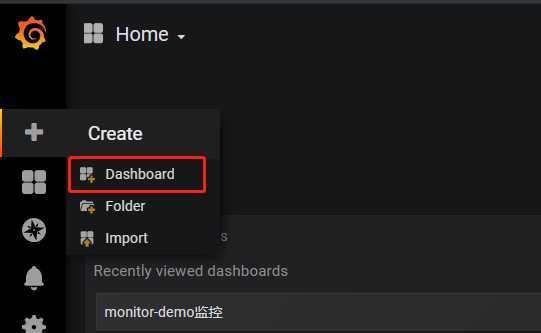
2. 創(chuàng)建一個(gè)Dashboard

3. 填寫(xiě)采集的指標(biāo)點(diǎn)
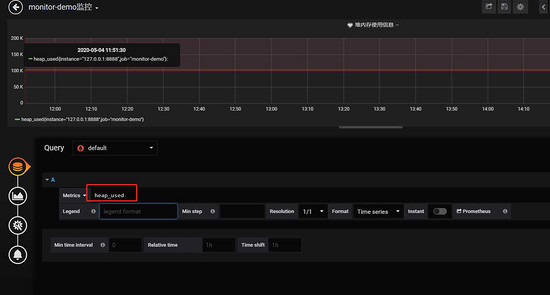
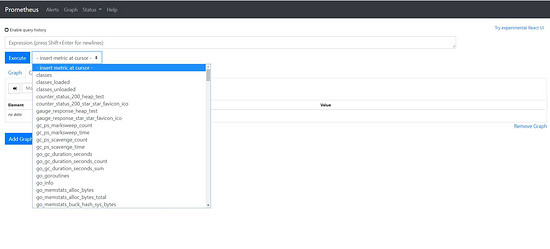
注意: 這里的指標(biāo)點(diǎn)不能隨便填,必須是已有的可以在 Prometheus看到。
4.選擇圖表樣式

5.填寫(xiě)標(biāo)題描述
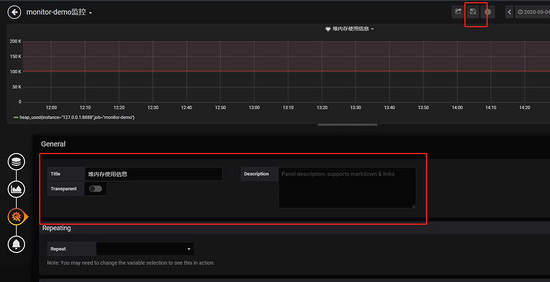
最后點(diǎn)擊右上角的保存,輸入Dashboad的名稱即可。
五、添加郵件報(bào)警
在實(shí)際項(xiàng)目中當(dāng)監(jiān)控的某的個(gè)指標(biāo)超過(guò)閾值(比如CPU使用率過(guò)高),希望監(jiān)控系統(tǒng)自動(dòng)通過(guò)短信、釘釘和郵件等方式報(bào)警及時(shí)通知運(yùn)維人員,Grafana就支持該功能。
第一步: 點(diǎn)擊[Alerting]——>[Notification channels]添加通知通道
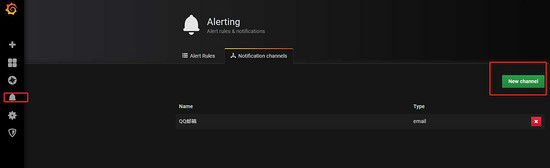
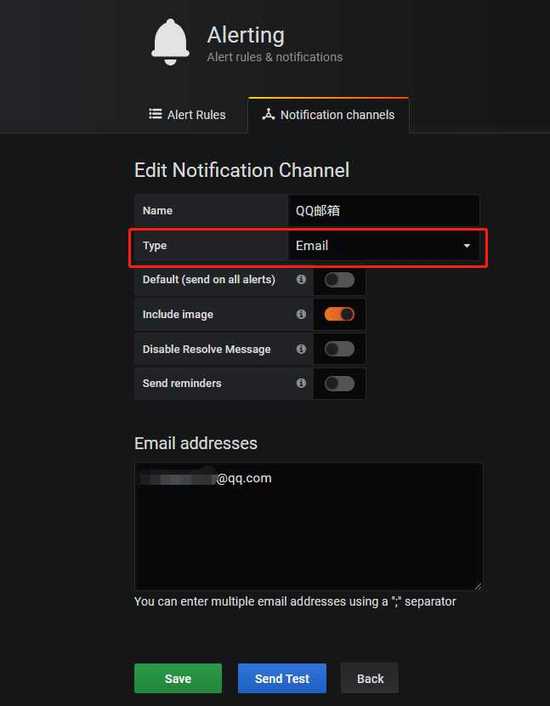
這里的Type有很多選項(xiàng),包括webhook、釘釘?shù)龋@里以郵件為例。
第二步: 郵箱配置
Grafana默認(rèn)使用conf目錄下defaults.ini作為配置文件運(yùn)行,根據(jù)官方的建議我們不要更改defaults.ini而是在同級(jí)目錄下新建一個(gè)配置文件custom.ini。
以騰訊企業(yè)郵箱為例,配置如下:
#################################### SMTP / Emailing #####################[smtp]enabled = truehost = smtp.exmail.qq.com:465user = xxxx@ininin.com# If the password contains # or ; you have to wrap it with triple quotes. Ex '''#password;'''password = XXXcert_file =key_file =skip_verify = truefrom_address = xxxx@ininin.comfrom_name = Grafanaehlo_identity = ininin.com
然后需要重啟Grafana,命令grafana-server.exe -config=E:filegrafana-6.3.3confcustom.ini
第三步: 為指標(biāo)添加alert
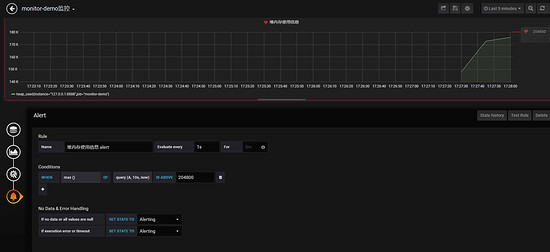

Evaluate every
表示檢測(cè)評(píng)率,這里為了測(cè)試效果,改為1秒
For
如果警報(bào)規(guī)則配置了For,并且查詢違反了配置的閾值,那么它將首先從OK變?yōu)镻ending。從OK到Pending Grafana不會(huì)發(fā)送任何通知。一旦警報(bào)規(guī)則的觸發(fā)時(shí)間超過(guò)持續(xù)時(shí)間,它將更改為Alerting并發(fā)送警報(bào)通知。
Conditions
when 表示什么時(shí)間,of 表示條件,is above 表示觸發(fā)值
同時(shí),設(shè)置了is above后會(huì)有一條紅線。
If no data or all values are null
如果沒(méi)有數(shù)據(jù)或所有值都為空,這里選擇觸發(fā)報(bào)警
If execution error or timeout
如果執(zhí)行錯(cuò)誤或超時(shí),這里選擇觸發(fā)報(bào)警
注意: 下一次觸發(fā),比如10秒后,它不會(huì)再次觸發(fā),防止報(bào)警風(fēng)暴產(chǎn)生!
第四步: 測(cè)試
請(qǐng)求http://localhost:8848/heap/test接口后,內(nèi)存升高大于設(shè)置的閾值,然后就收到報(bào)警郵件。
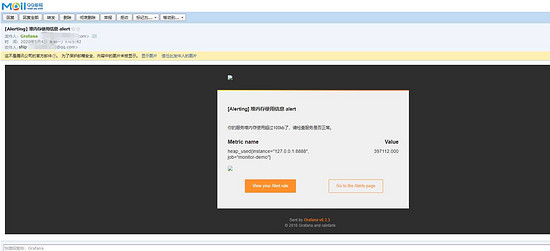
這里圖片沒(méi)有顯示出來(lái),搞不懂為什么。
到此這篇關(guān)于SpringBoot+Prometheus+Grafana實(shí)現(xiàn)應(yīng)用監(jiān)控和報(bào)警的詳細(xì)步驟的文章就介紹到這了,更多相關(guān)SpringBoot+Prometheus+Grafana實(shí)現(xiàn)監(jiān)控和報(bào)警內(nèi)容請(qǐng)搜索好吧啦網(wǎng)以前的文章或繼續(xù)瀏覽下面的相關(guān)文章希望大家以后多多支持好吧啦網(wǎng)!
相關(guān)文章:
1. python excel和yaml文件的讀取封裝2. moment轉(zhuǎn)化時(shí)間戳出現(xiàn)Invalid Date的問(wèn)題及解決3. python爬蟲(chóng)實(shí)戰(zhàn)之制作屬于自己的一個(gè)IP代理模塊4. Python內(nèi)存映射文件讀寫(xiě)方式5. php實(shí)現(xiàn)當(dāng)前用戶在線人數(shù)6. Android中的緩存7. Android Studio插件8. .net6 在中標(biāo)麒麟下的安裝和部署過(guò)程9. Java CountDownLatch應(yīng)用場(chǎng)景代碼實(shí)例10. Python中內(nèi)建模塊collections如何使用

 網(wǎng)公網(wǎng)安備