SpringBoot使用prometheus監控的示例代碼
本文介紹SpringBoot如何使用Prometheus配合Grafana監控。
1.關于PrometheusPrometheus是一個根據應用的metrics來進行監控的開源工具。相信很多工程都在使用它來進行監控,有關詳細介紹可以查看官網:https://prometheus.io/docs/introduction/overview/。
2.有關GrafanaGrafana是一個開源監控利器,如圖所示。

從圖中就可以看出來,使用Grafana監控很高大上,提供了很多可視化的圖標。
官網地址:https://grafana.com/
3.SpringBoot使用Prometheus3.1 依賴內容在SpringBoot中使用Prometheus其實很簡單,不需要配置太多的東西,在pom文件中加入依賴,完整內容如下所示。
<?xml version='1.0' encoding='UTF-8'?><project xmlns='http://maven.apache.org/POM/4.0.0' xmlns:xsi='http://www.w3.org/2001/XMLSchema-instance'xsi:schemaLocation='http://maven.apache.org/POM/4.0.0 http://maven.apache.org/xsd/maven-4.0.0.xsd'><modelVersion>4.0.0</modelVersion><parent><groupId>org.springframework.boot</groupId><artifactId>spring-boot-starter-parent</artifactId><version>2.1.3.RELEASE</version><relativePath/> <!-- lookup parent from repository --></parent><groupId>com.dalaoyang</groupId><artifactId>springboot2_prometheus</artifactId><version>0.0.1-SNAPSHOT</version><name>springboot2_prometheus</name><description>springboot2_prometheus</description><properties><java.version>1.8</java.version></properties><dependencies><dependency><groupId>org.springframework.boot</groupId><artifactId>spring-boot-starter-actuator</artifactId></dependency><dependency><groupId>org.springframework.boot</groupId><artifactId>spring-boot-starter-web</artifactId></dependency><dependency><groupId>org.springframework.boot</groupId><artifactId>spring-boot-starter-test</artifactId><scope>test</scope></dependency><dependency><groupId>io.micrometer</groupId><artifactId>micrometer-registry-prometheus</artifactId><version>1.1.3</version></dependency></dependencies><build><plugins><plugin><groupId>org.springframework.boot</groupId><artifactId>spring-boot-maven-plugin</artifactId></plugin></plugins></build></project>3.2 配置文件
配置文件中加入配置,這里就只進行一些簡單配置,management.metrics.tags.application屬性是本文配合Grafana的Dashboard設置的,如下所示:
spring.application.name=springboot_prometheusmanagement.endpoints.web.exposure.include=*management.metrics.tags.application=${spring.application.name}3.3 設置application
修改啟動類,如下所示.
@SpringBootApplicationpublic class Springboot2PrometheusApplication {public static void main(String[] args) {SpringApplication.run(Springboot2PrometheusApplication.class, args);}@BeanMeterRegistryCustomizer<MeterRegistry> configurer(@Value('${spring.application.name}') String applicationName) {return (registry) -> registry.config().commonTags('application', applicationName);}}
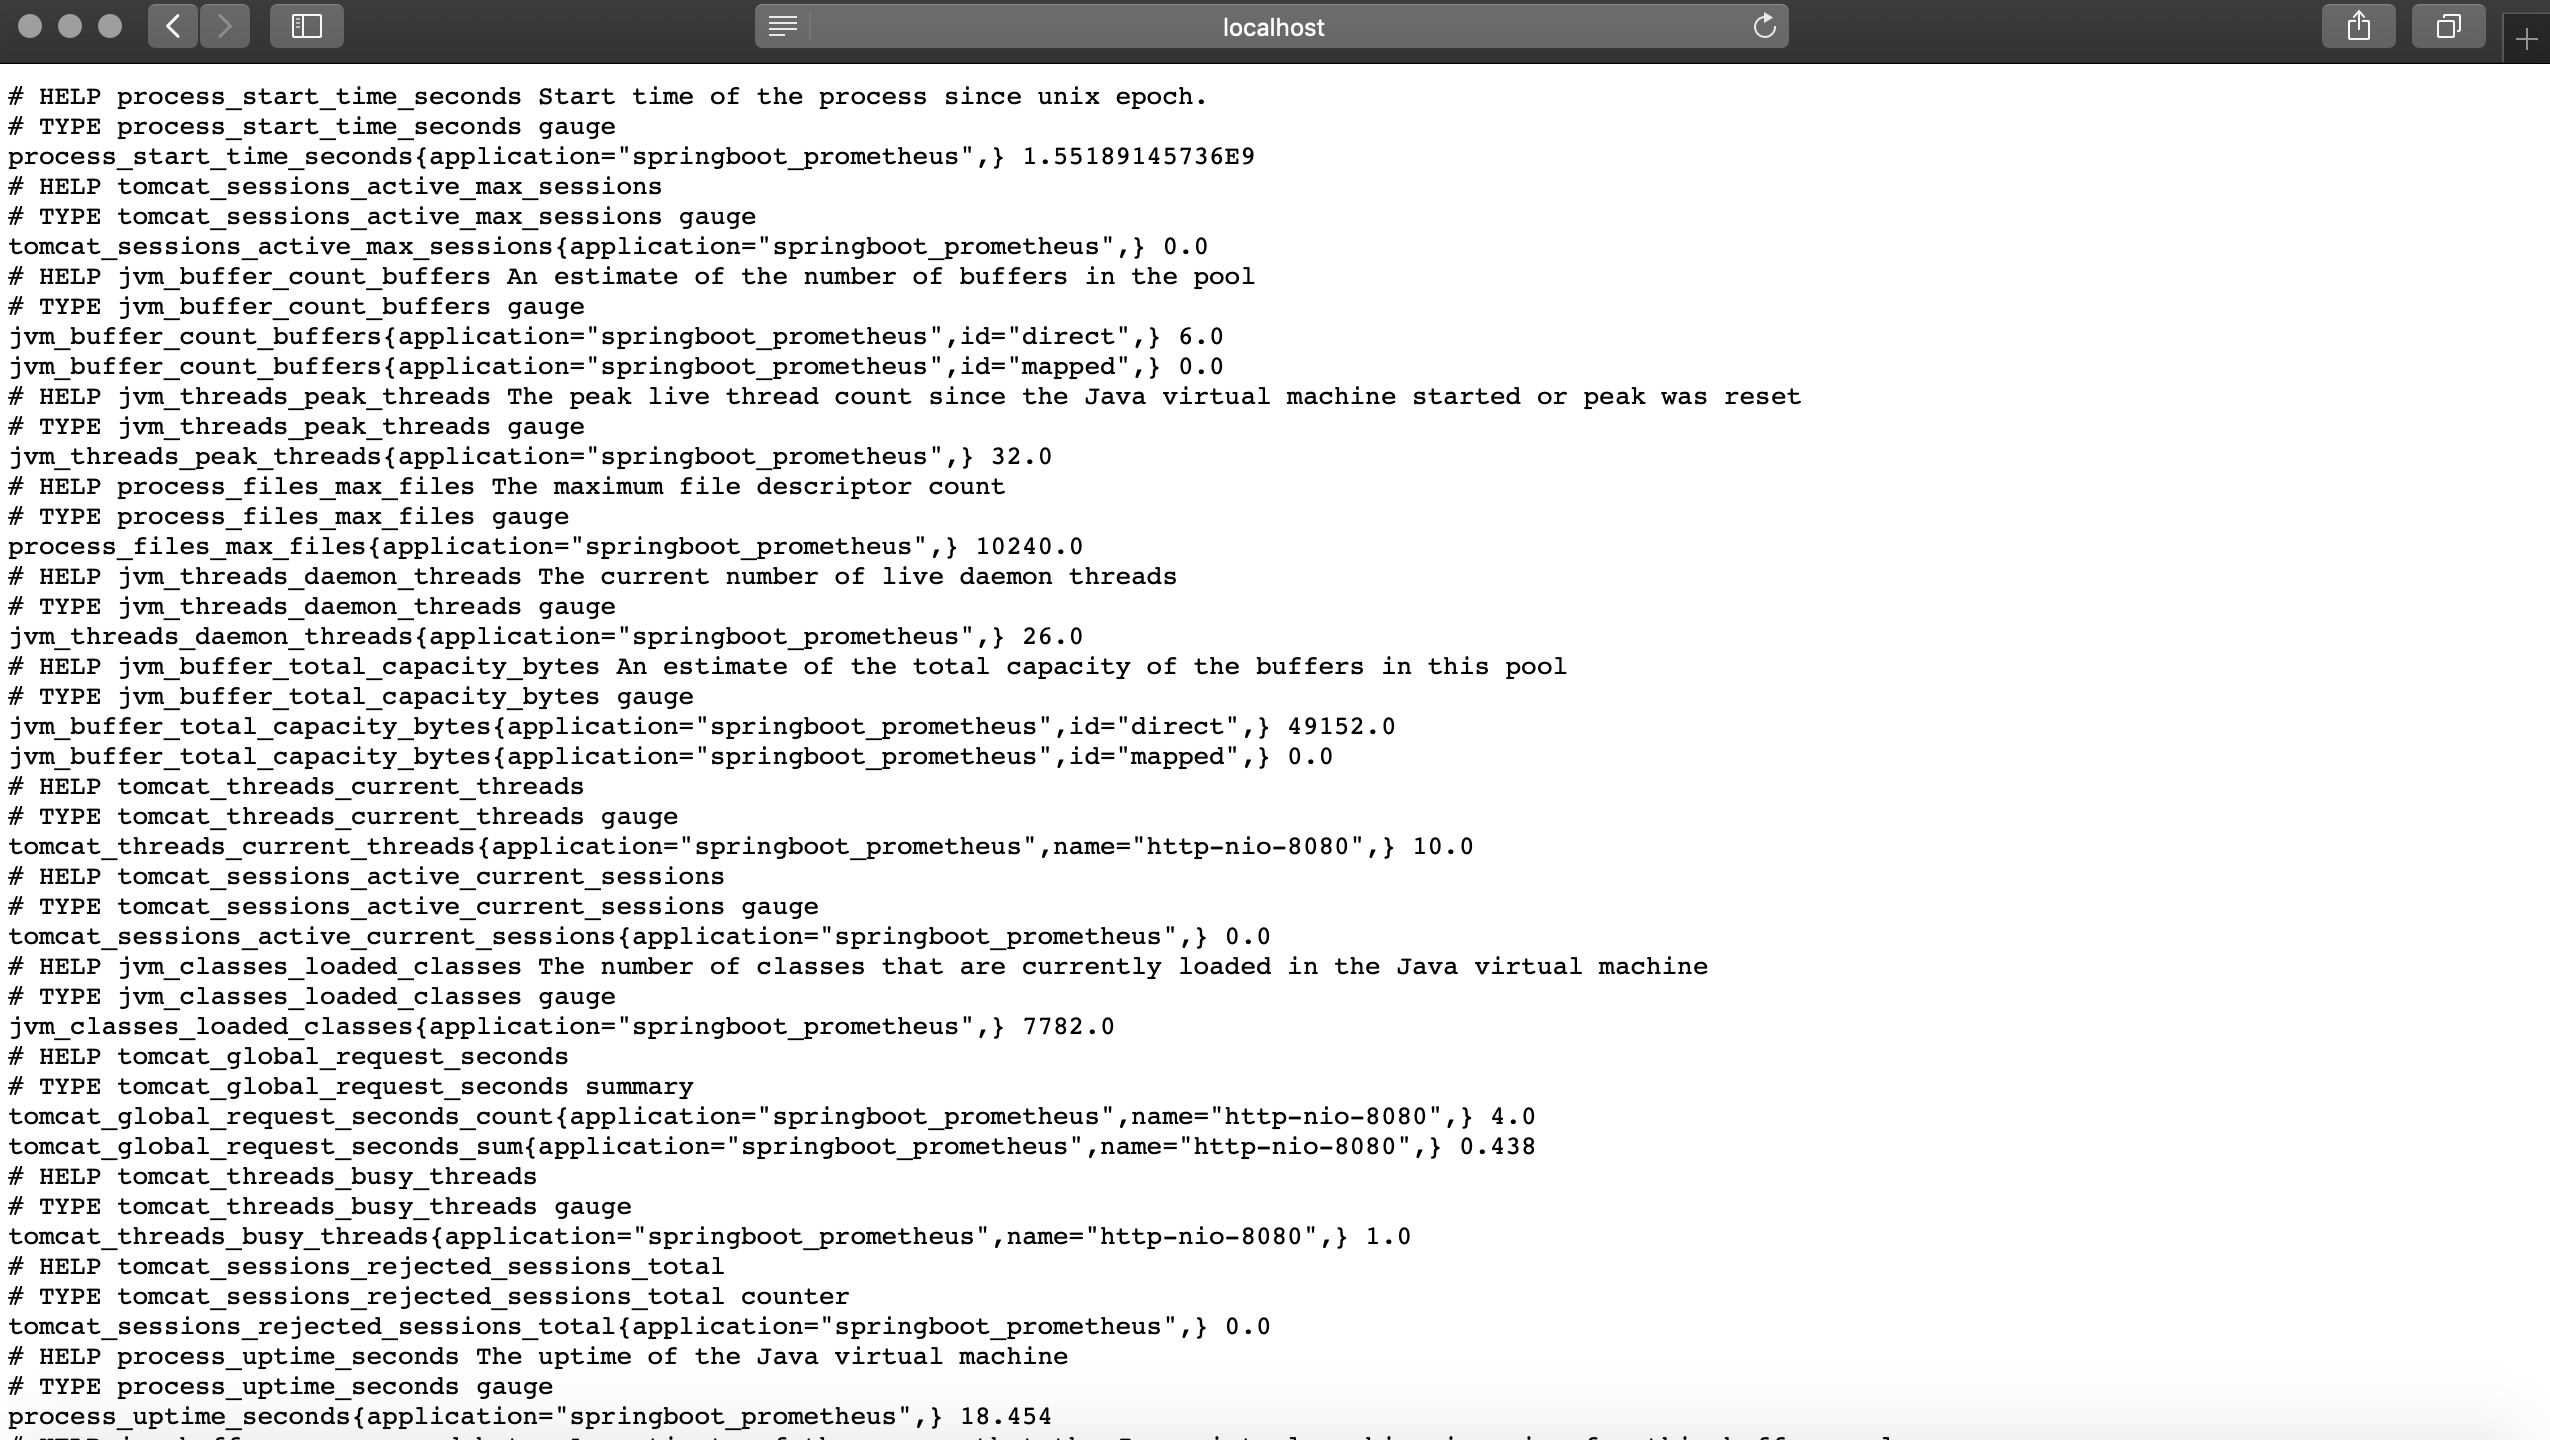
SpringBoot項目到這里就配置完成了,啟動項目,訪問http://localhost:8080/actuator/prometheus,如圖所示,可以看到一些度量指標。
在prometheus配置監控我們的SpringBoot應用,完整配置如下所示。
# my global configglobal: scrape_interval: 15s # Set the scrape interval to every 15 seconds. Default is every 1 minute. evaluation_interval: 15s # Evaluate rules every 15 seconds. The default is every 1 minute. # scrape_timeout is set to the global default (10s).# Alertmanager configurationalerting: alertmanagers: - static_configs: - targets: # - alertmanager:9093# Load rules once and periodically evaluate them according to the global ’evaluation_interval’.rule_files: # - 'first_rules.yml' # - 'second_rules.yml'# A scrape configuration containing exactly one endpoint to scrape:# Here it’s Prometheus itself.scrape_configs: - job_name: ’prometheus’ static_configs: - targets: [’127.0.0.1:9090’]###以下內容為SpringBoot應用配置 - job_name: ’springboot_prometheus’ scrape_interval: 5s metrics_path: ’/actuator/prometheus’ static_configs: - targets: [’127.0.0.1:8080’]4.2 啟動Prometheus
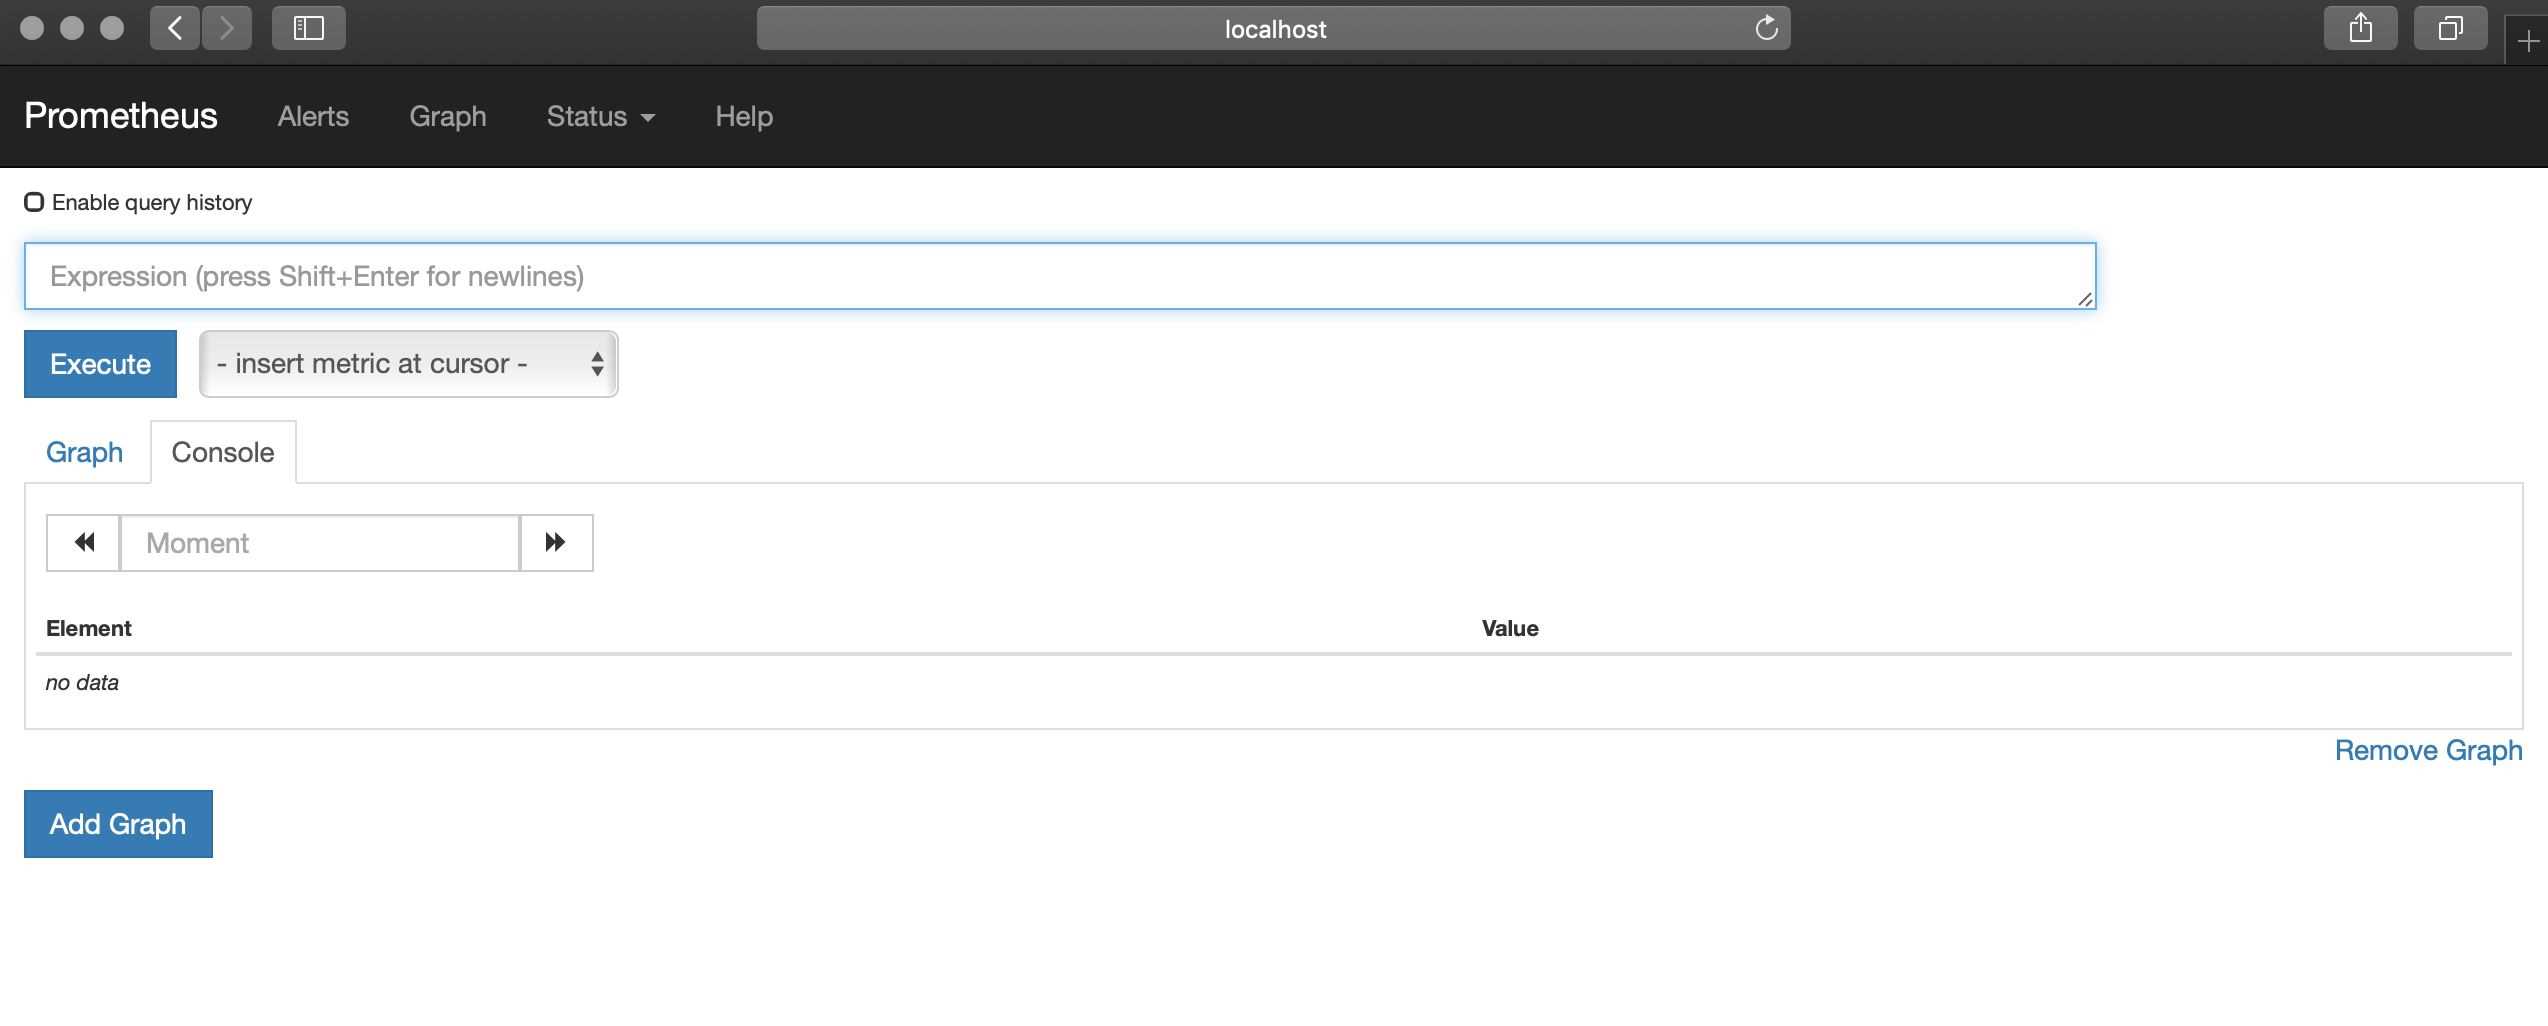
啟動Prometheus,瀏覽器訪問,查看Prometheus頁面,如圖所示。
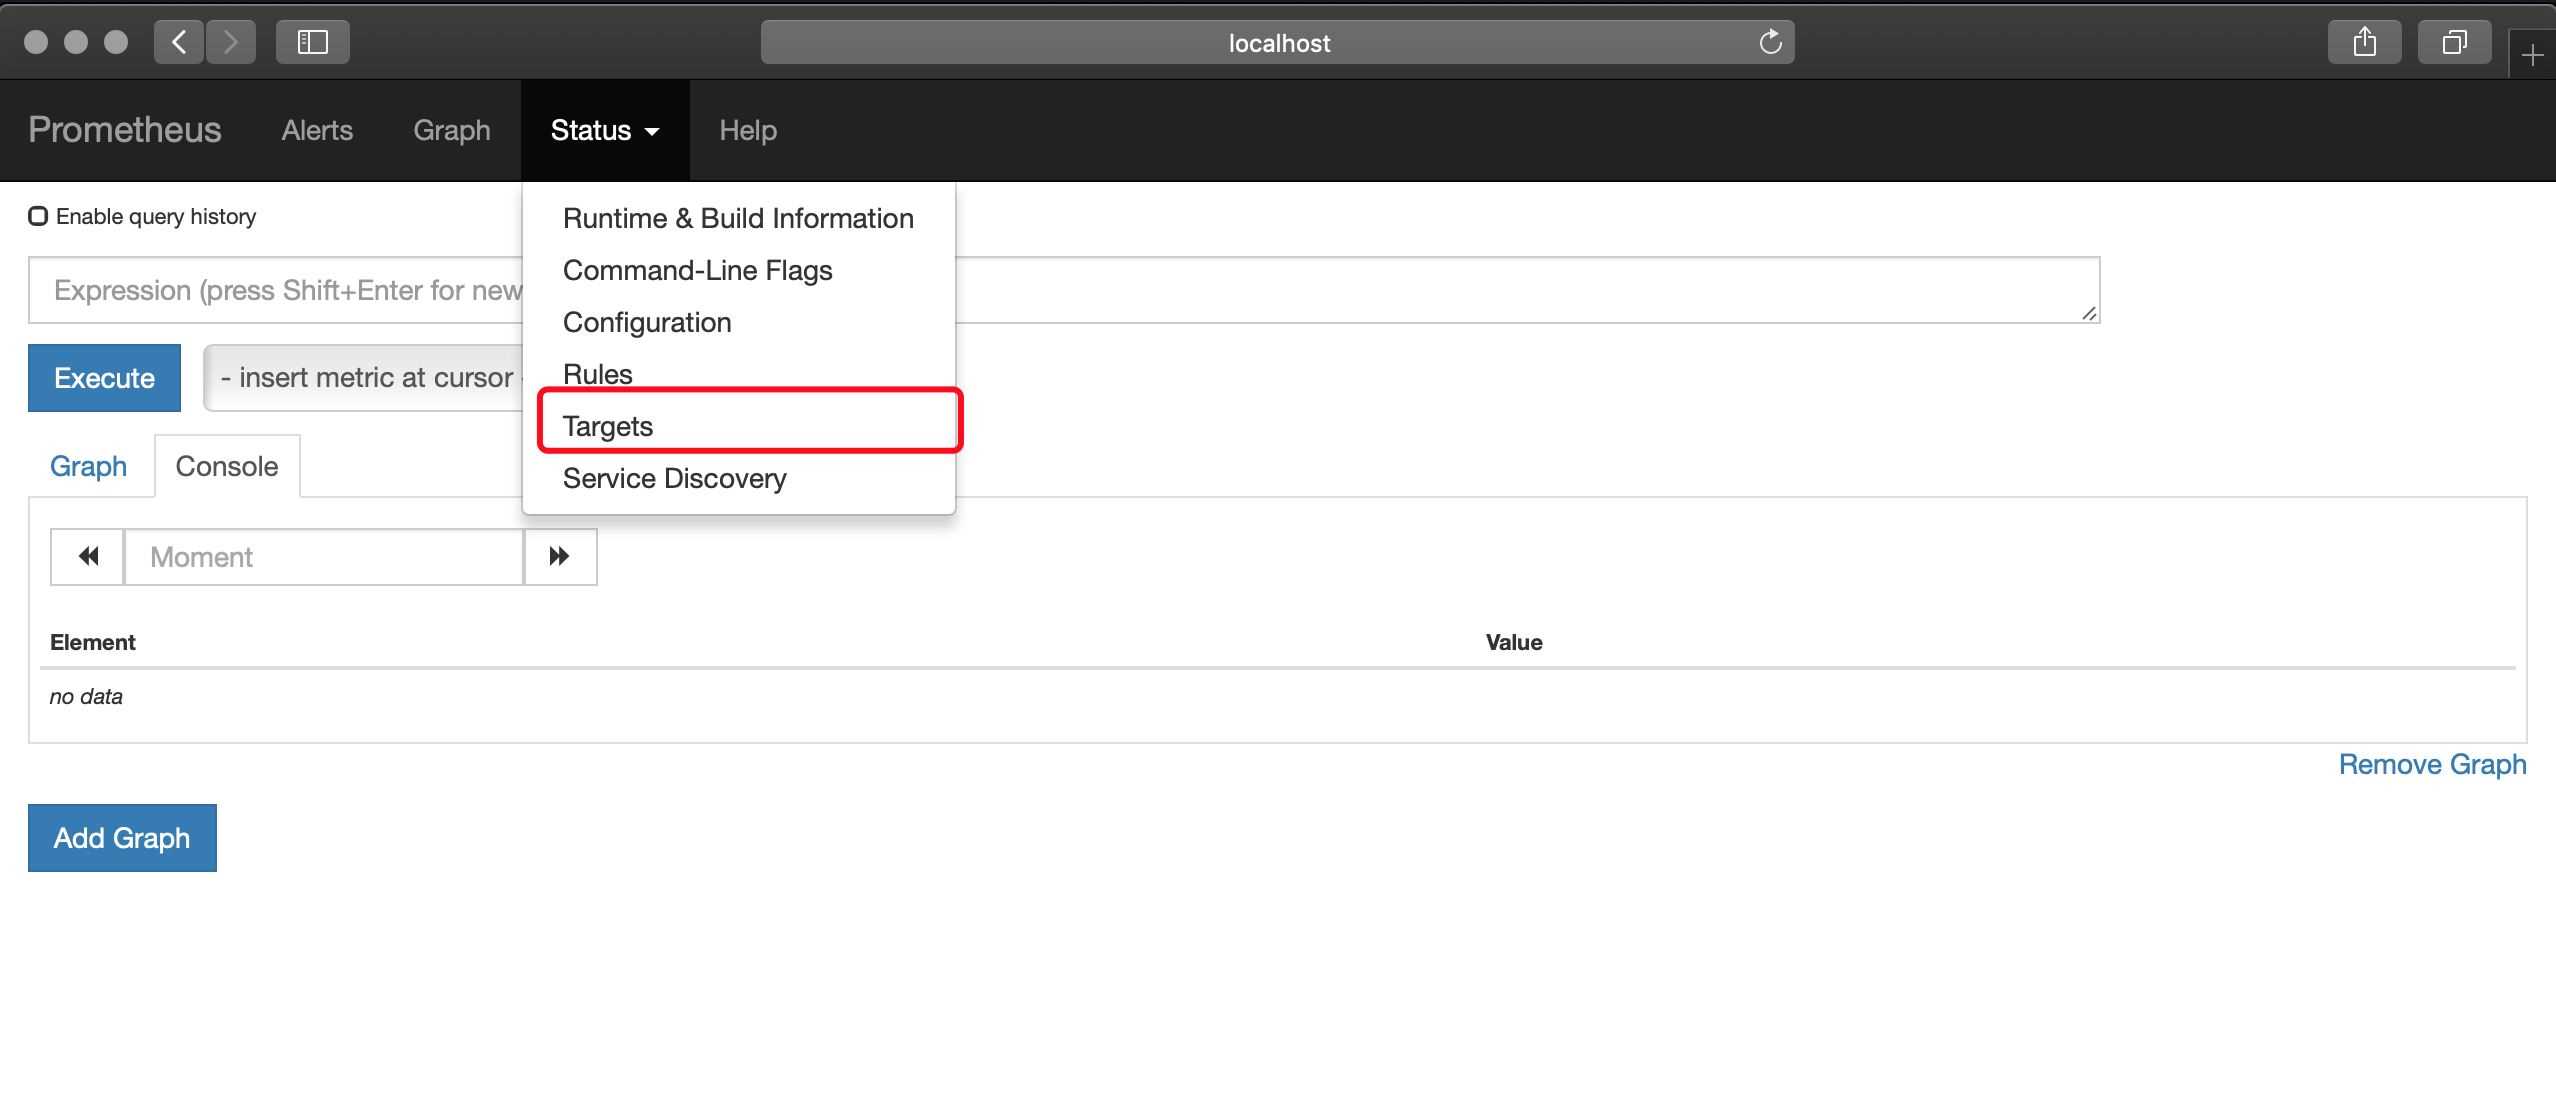
點擊如圖所示位置,可以查看Prometheus監控的應用。
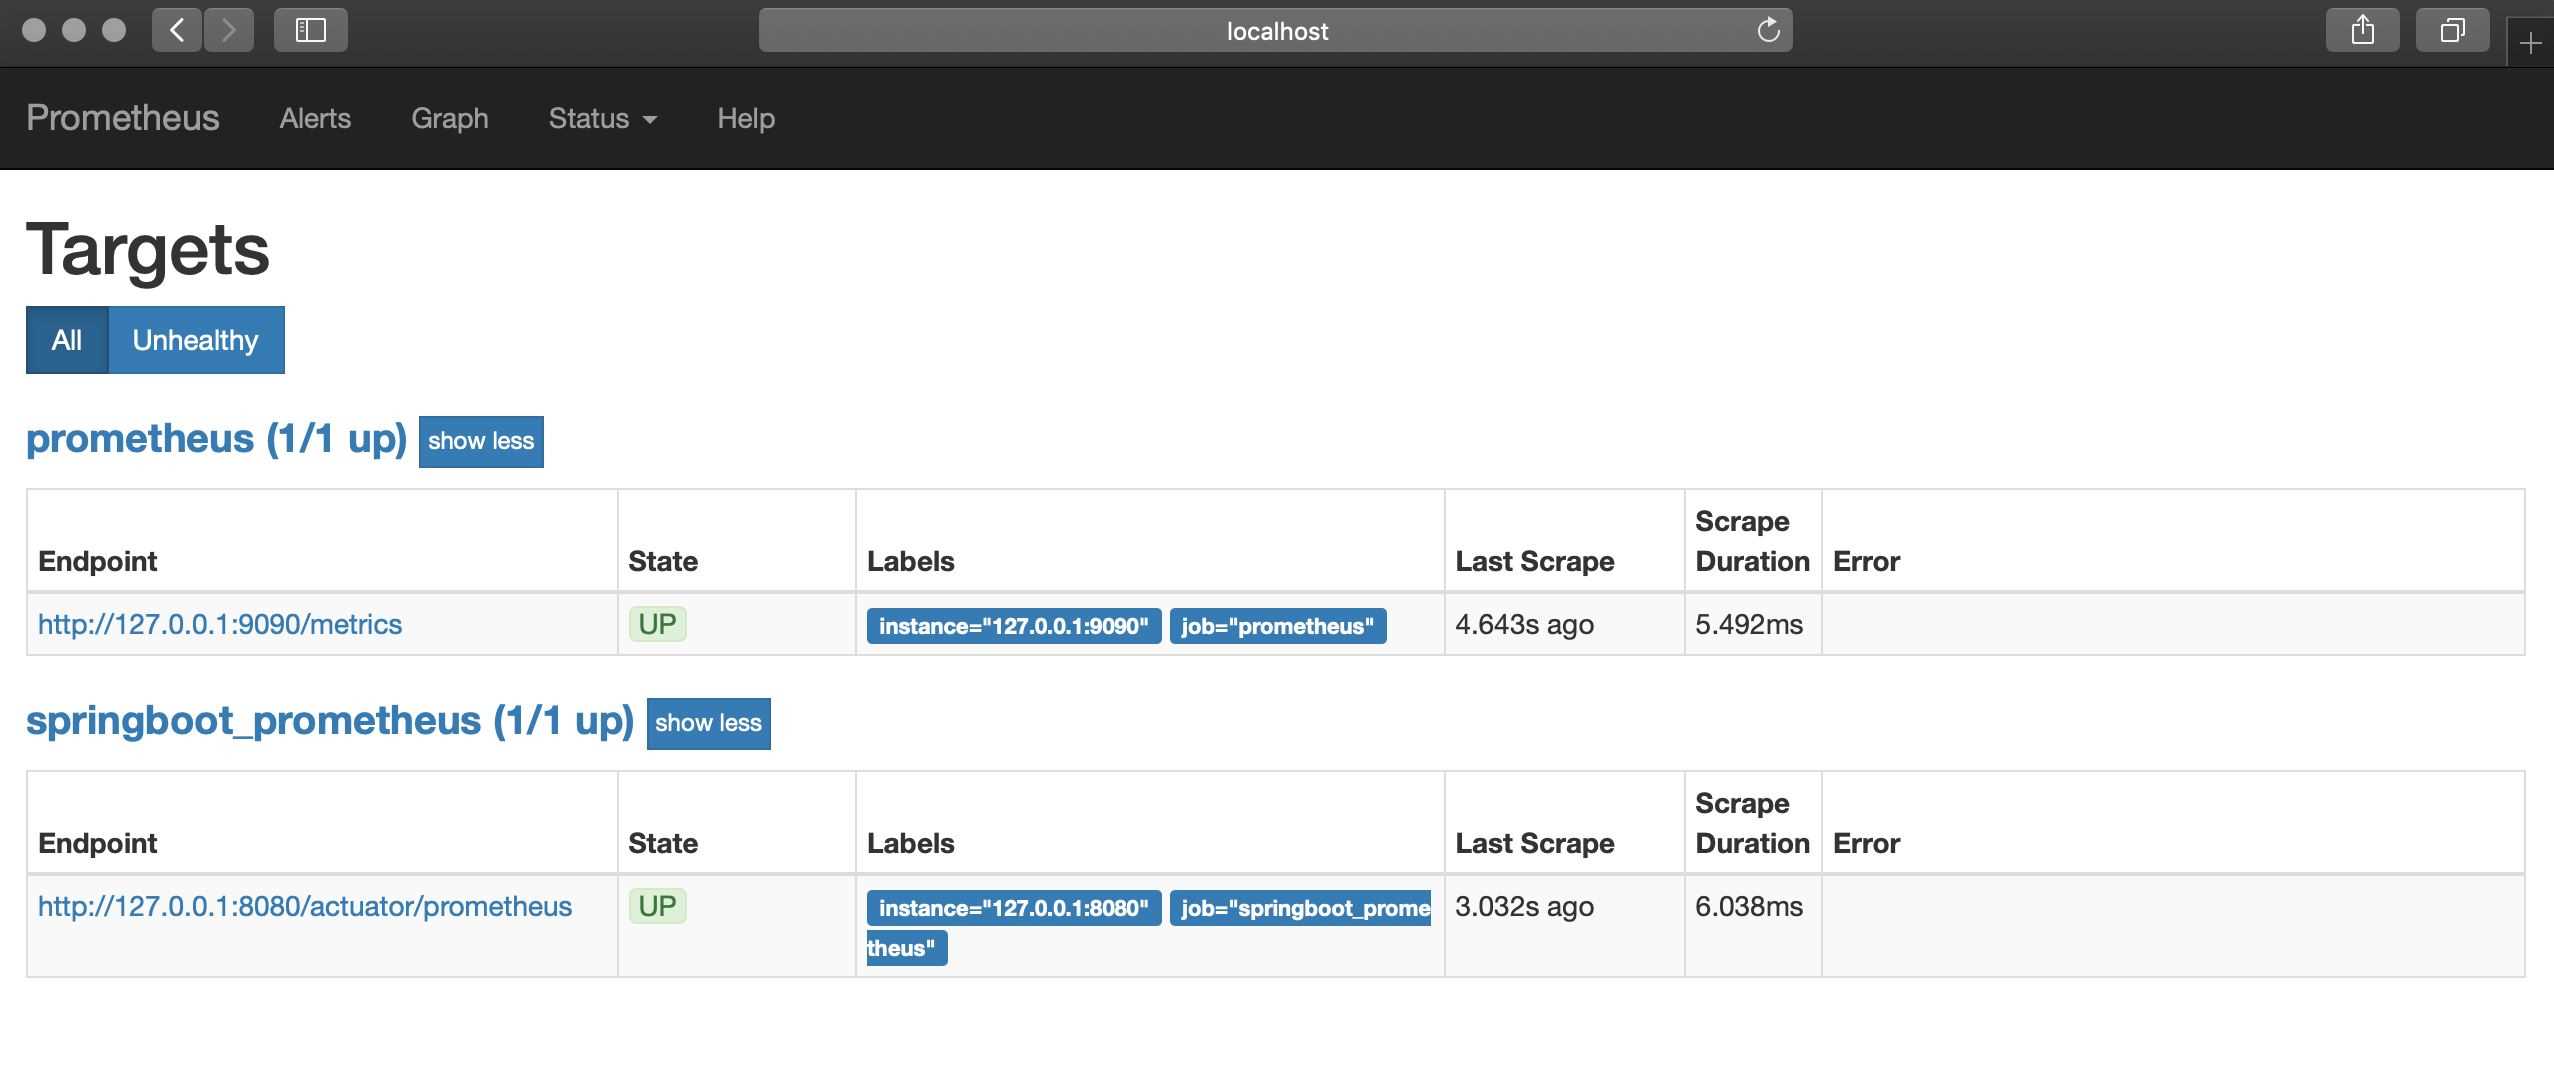
列表中UP的頁面為存活的實例,如圖所示。
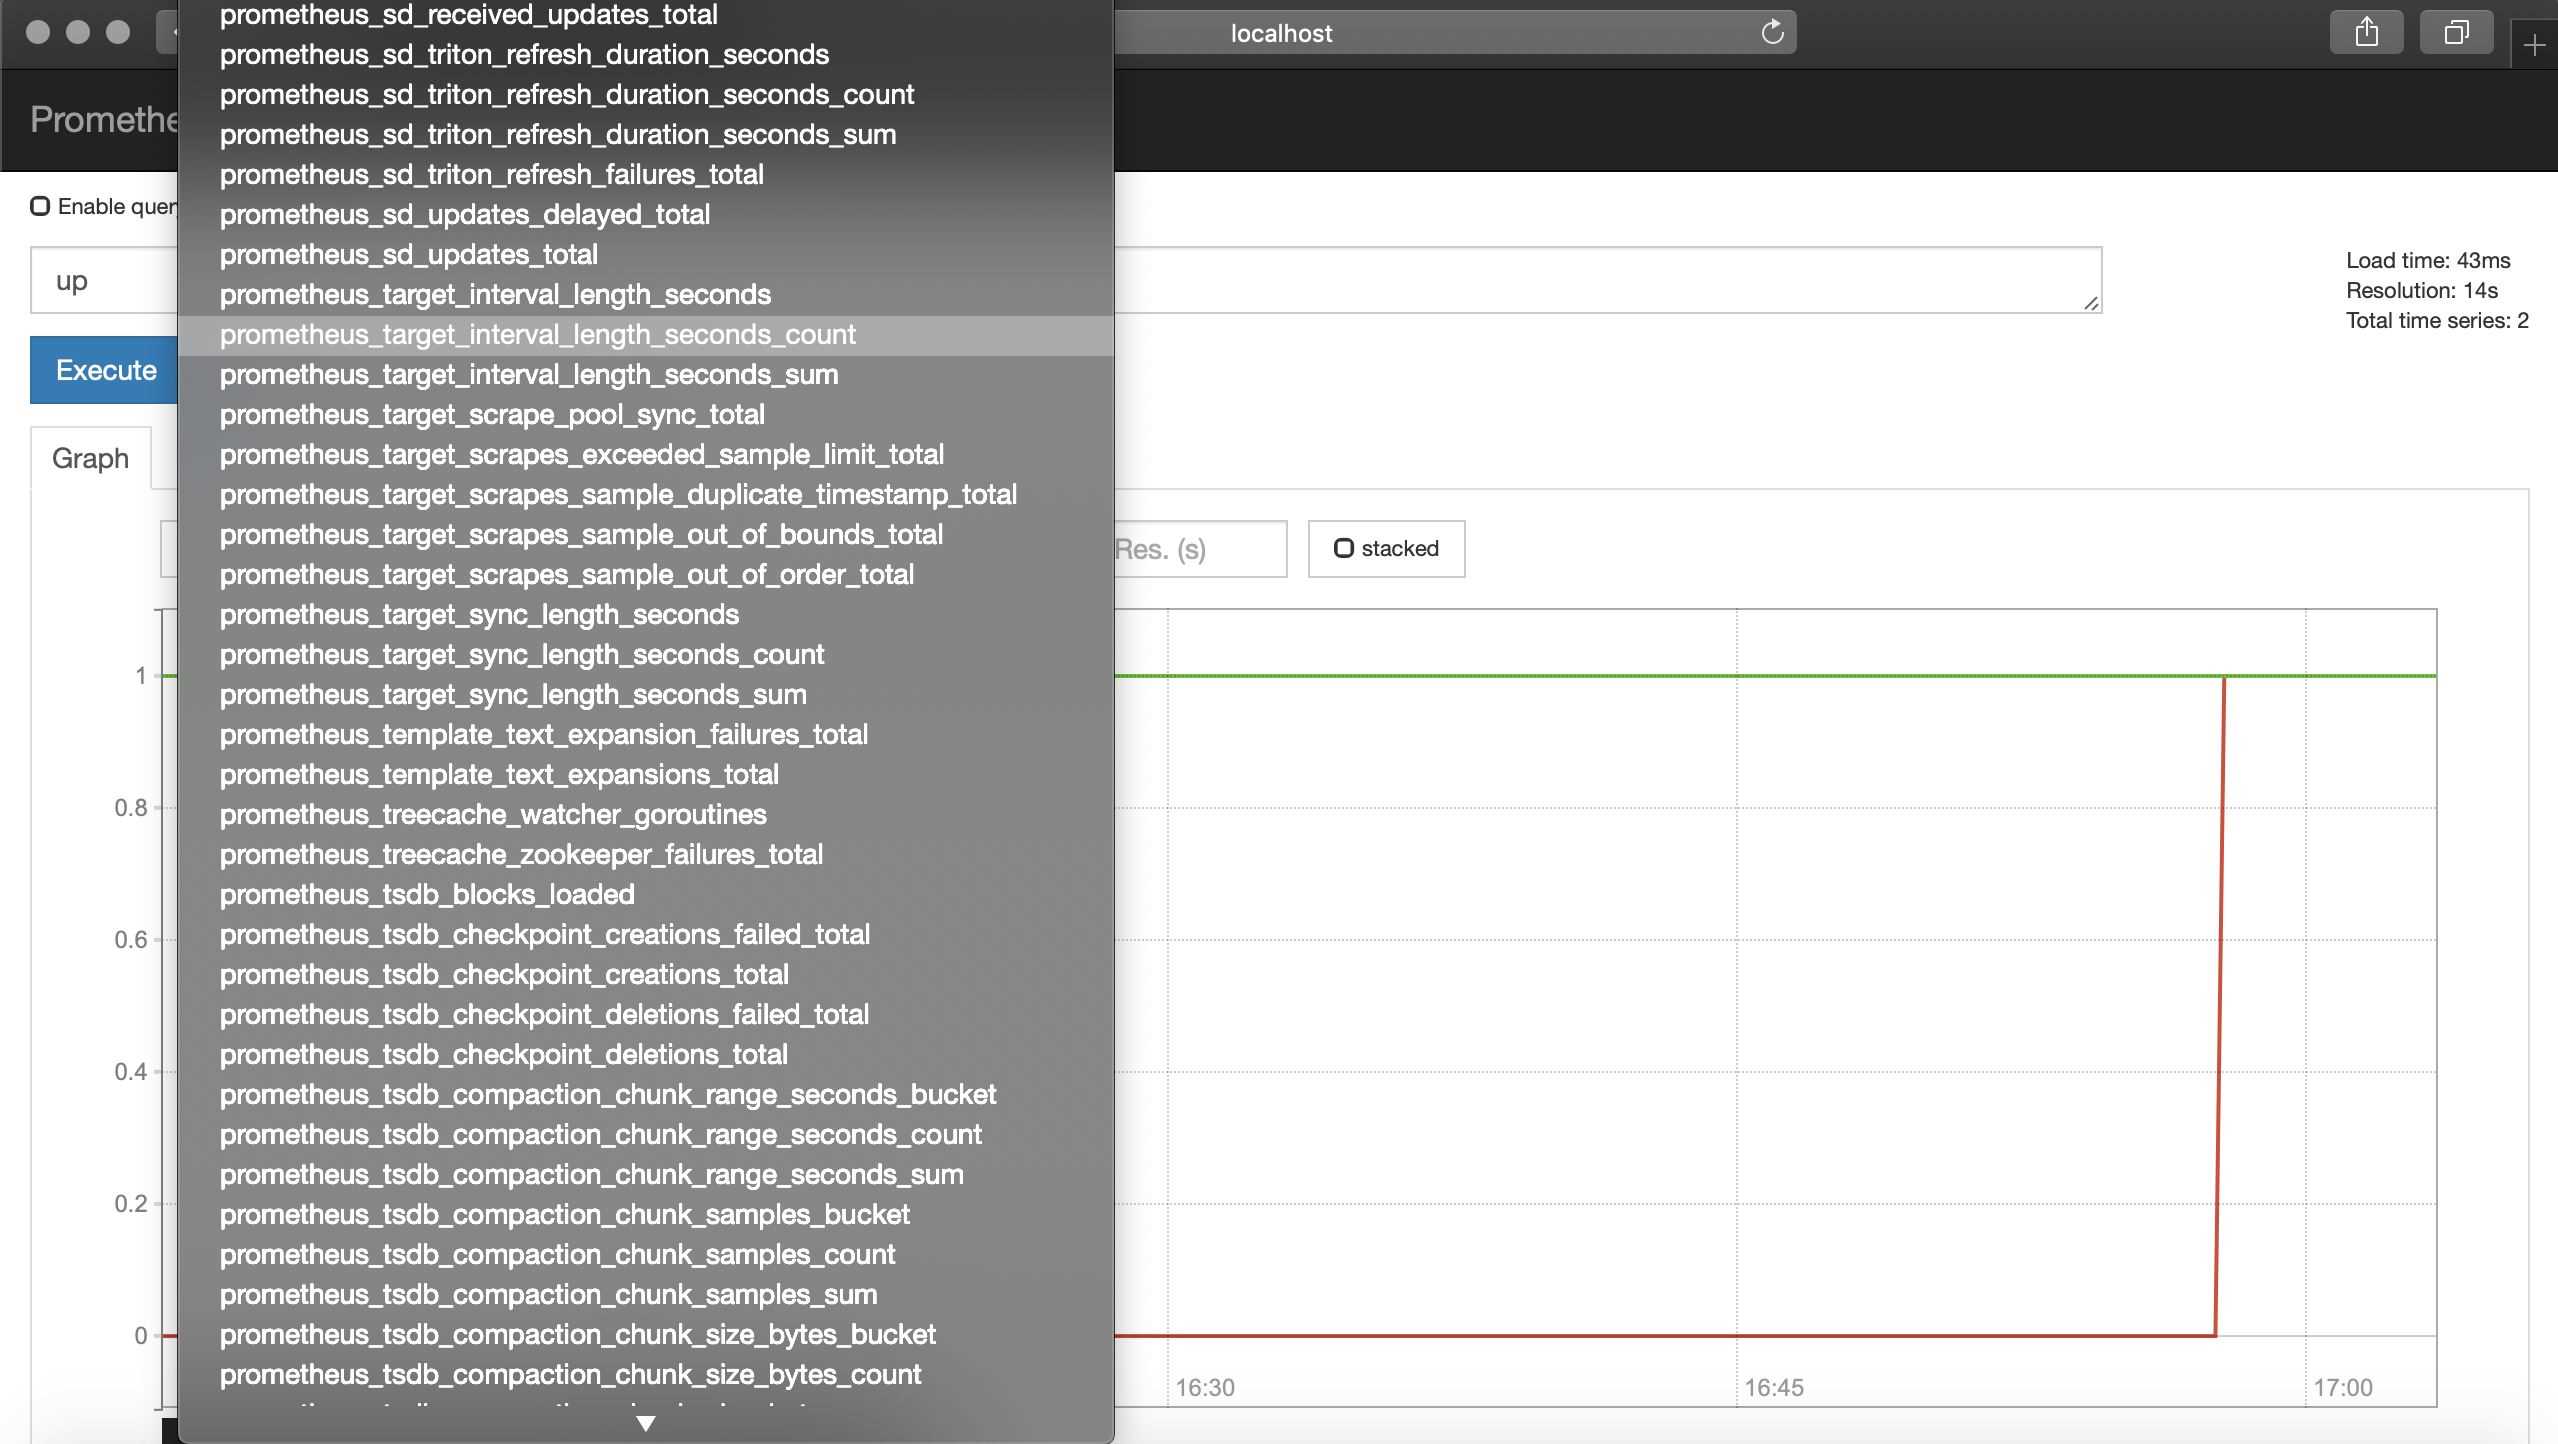
也可以查看很多指數,如下所示。
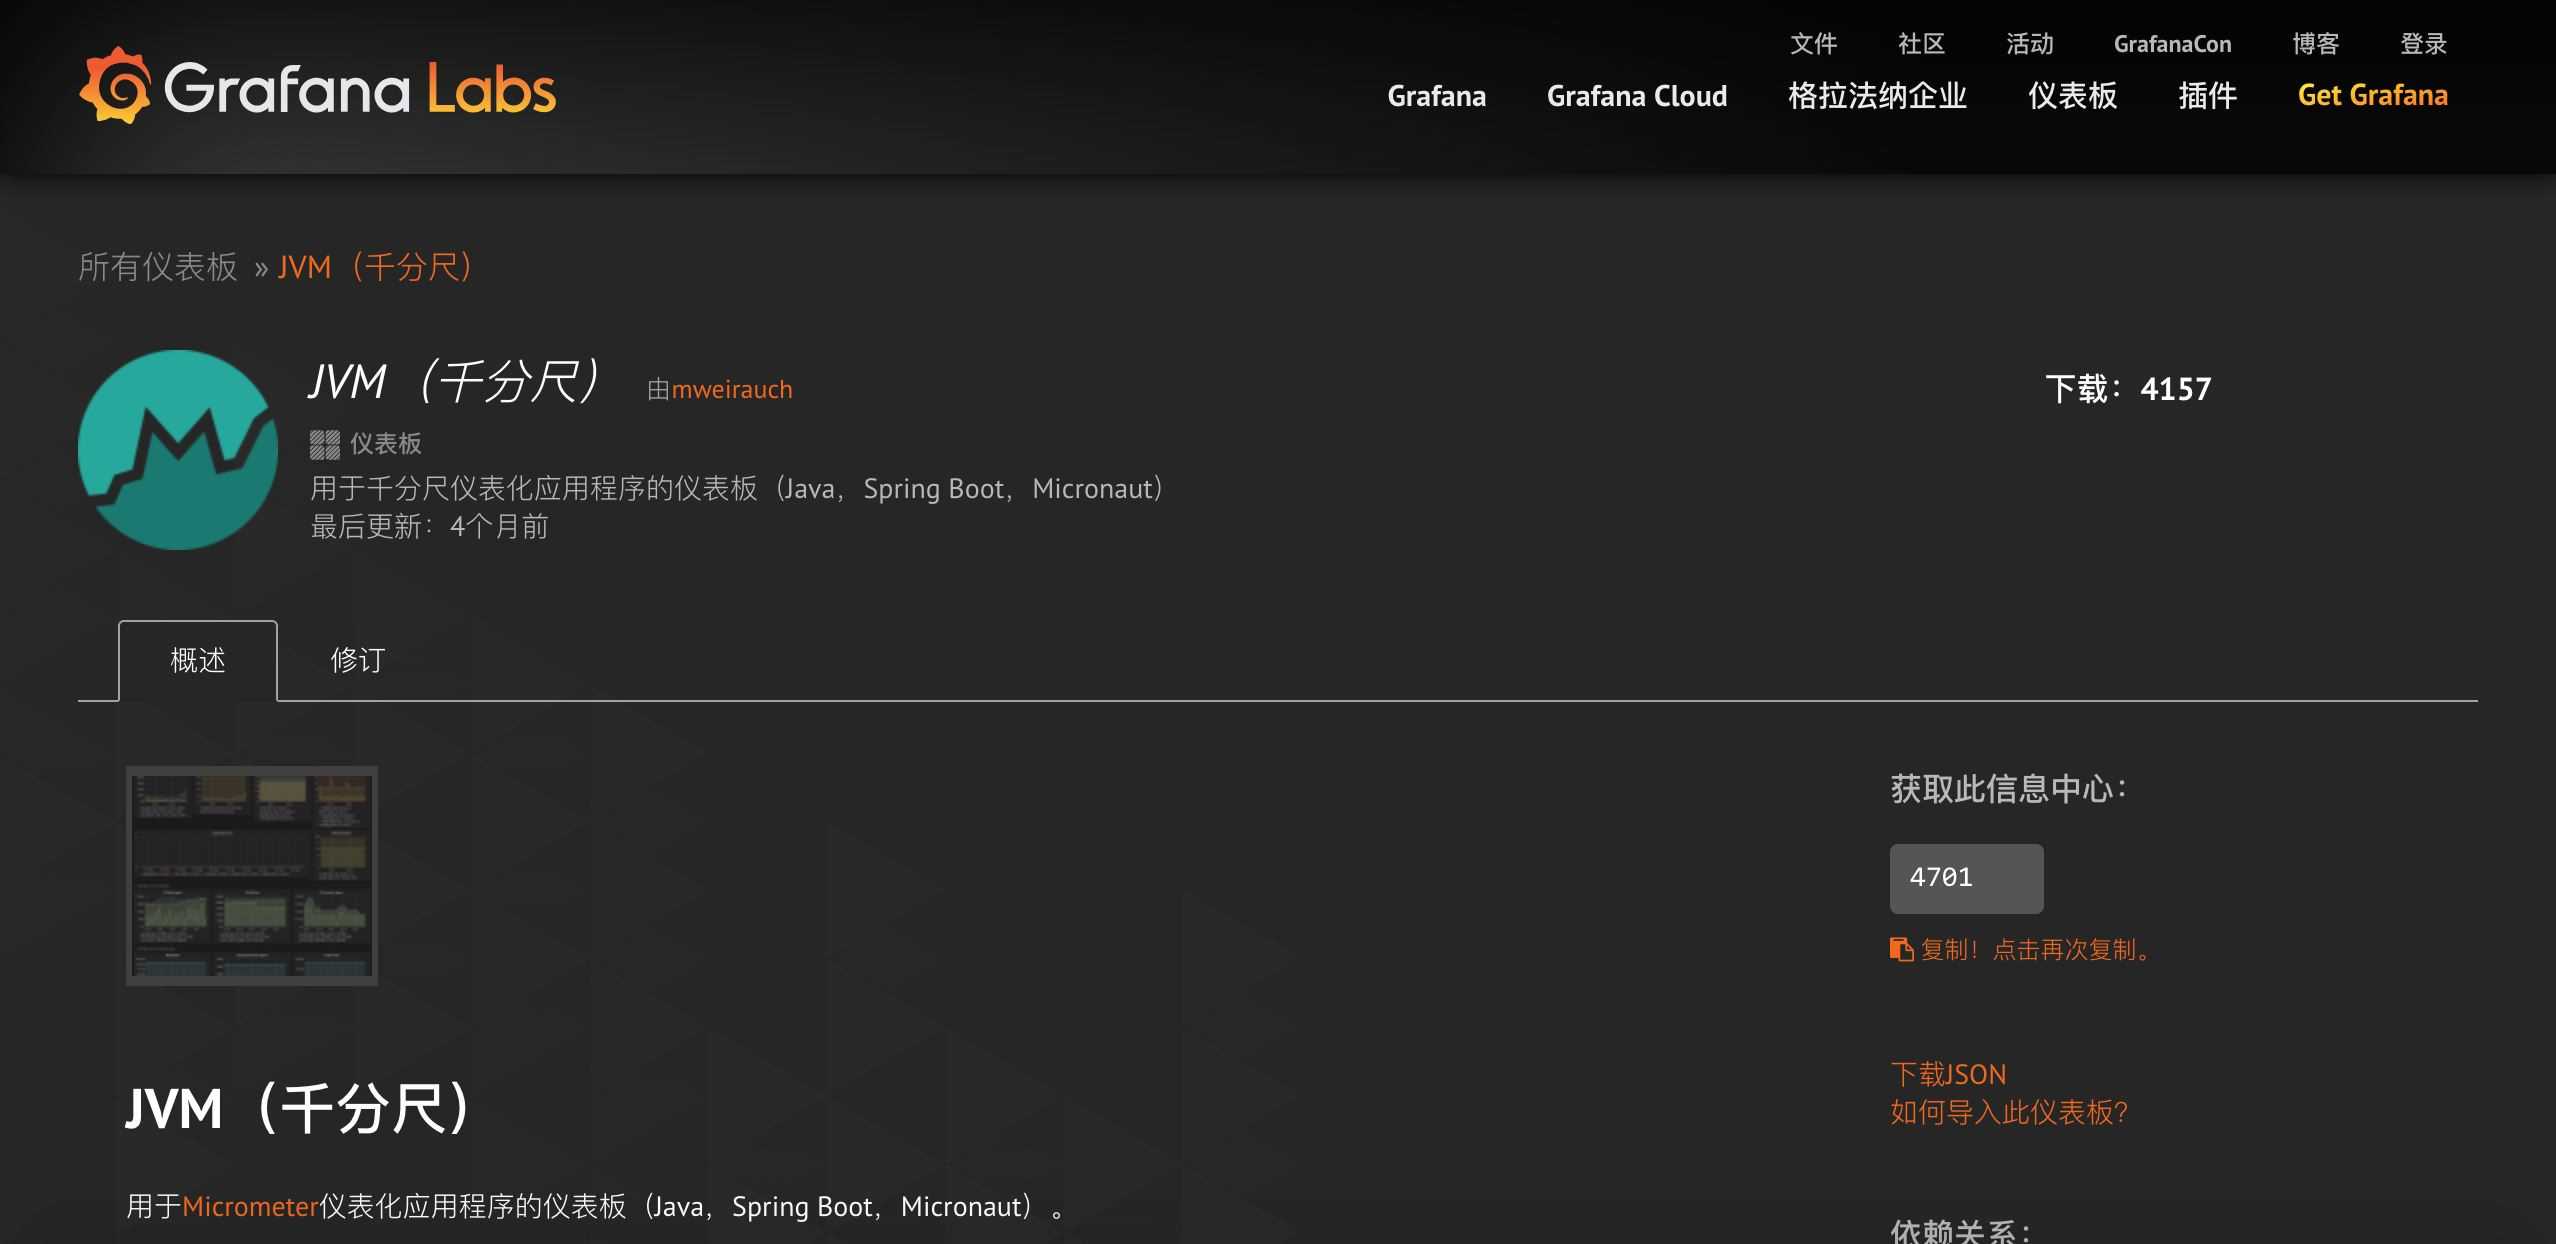
啟動Grafana,配置Prometheus數據源,這里以ID是4701的Doshboard為例(地址:https://grafana.com/dashboards/4701)如圖。
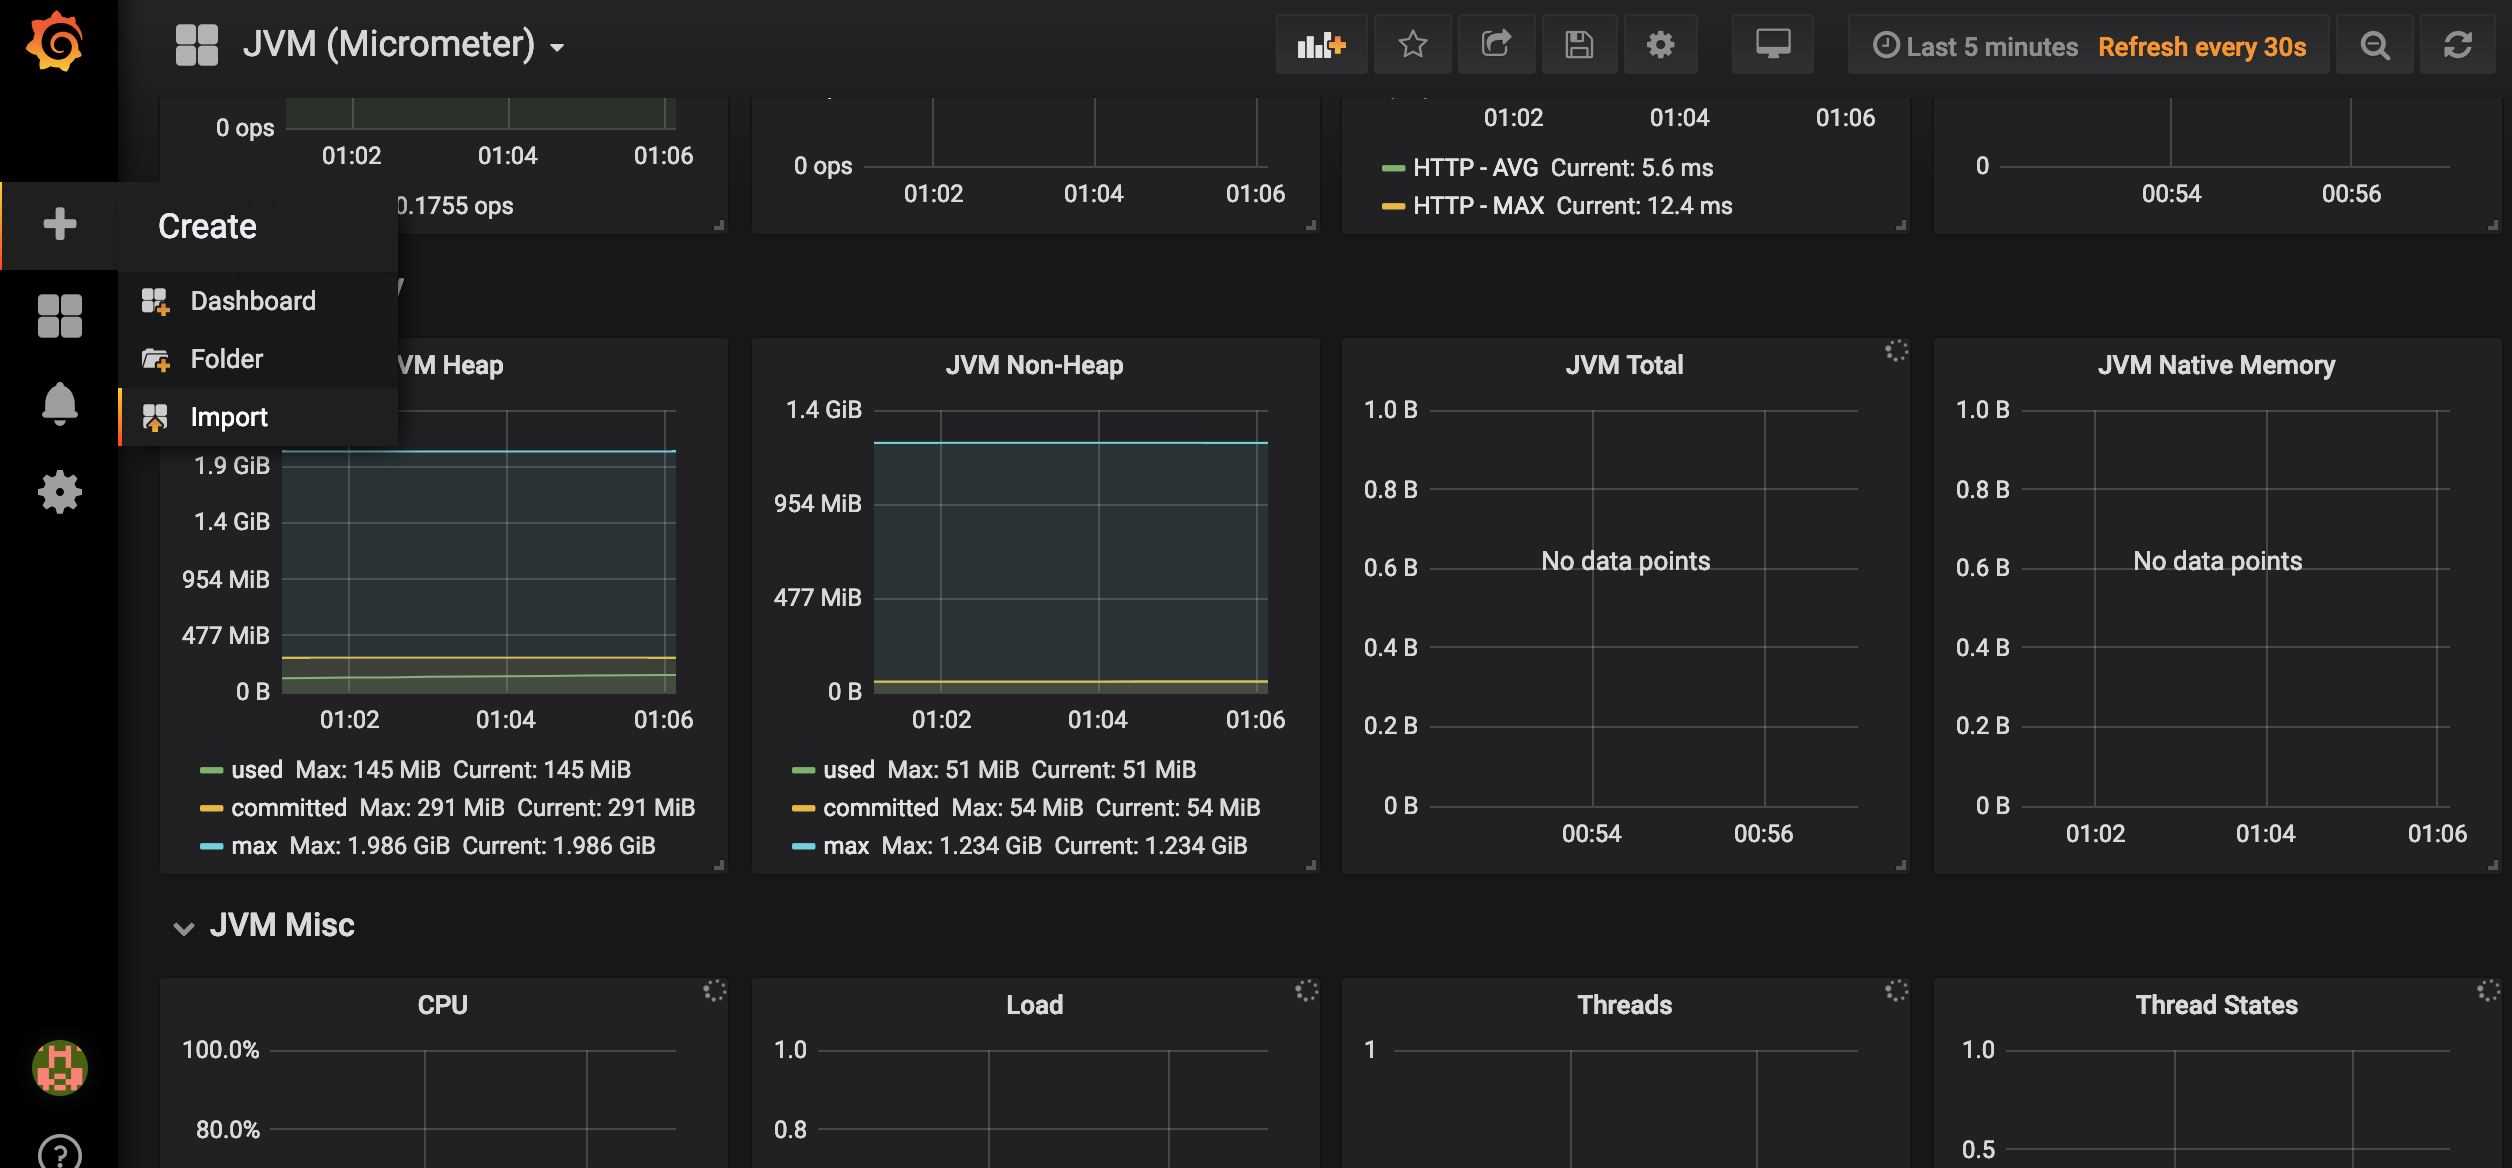
在Grafana內點擊如圖所示import按鈕
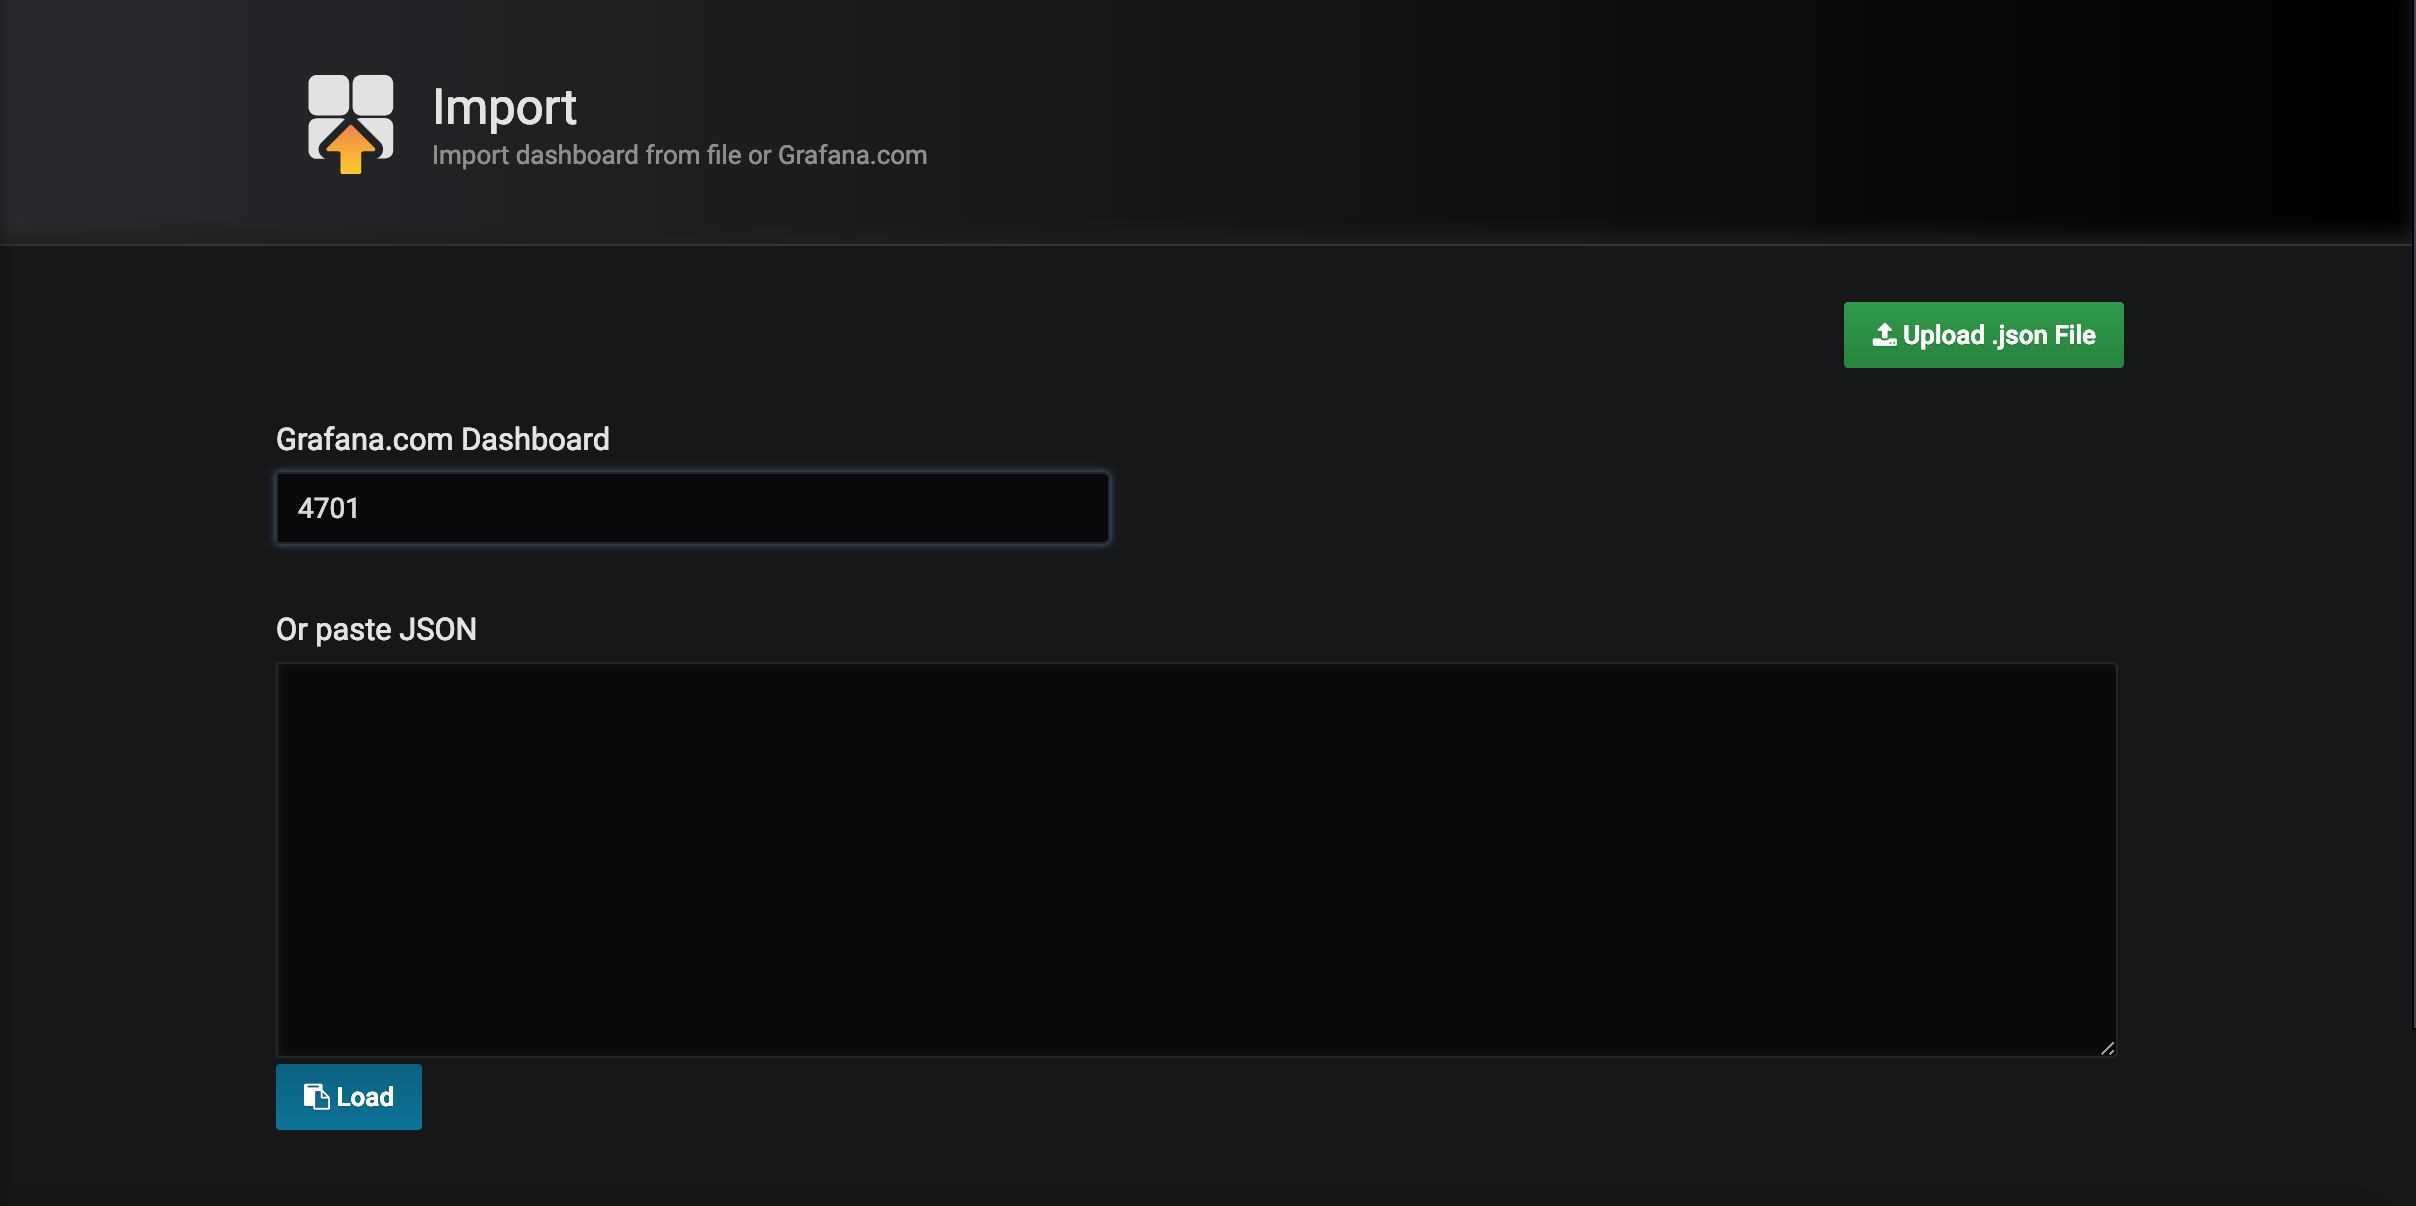
在如圖所示位置填寫4701,然后點擊load。
接下來導入Doshboard。
導入后就可以看到我們的SpringBoot項目對應的指標圖表了,如圖。
源碼地址:https://gitee.com/dalaoyang/springboot_learn/tree/master/springboot2_prometheus
到此這篇關于SpringBoot使用prometheus監控的示例代碼的文章就介紹到這了,更多相關SpringBoot prometheus監控內容請搜索好吧啦網以前的文章或繼續瀏覽下面的相關文章希望大家以后多多支持好吧啦網!
相關文章:

 網公網安備
網公網安備